This is a use case example for how to set up a user pivot report in Infoplus to show dynamic data about an action(s) that runs in Infoplus.
Creating User Pivot Reports
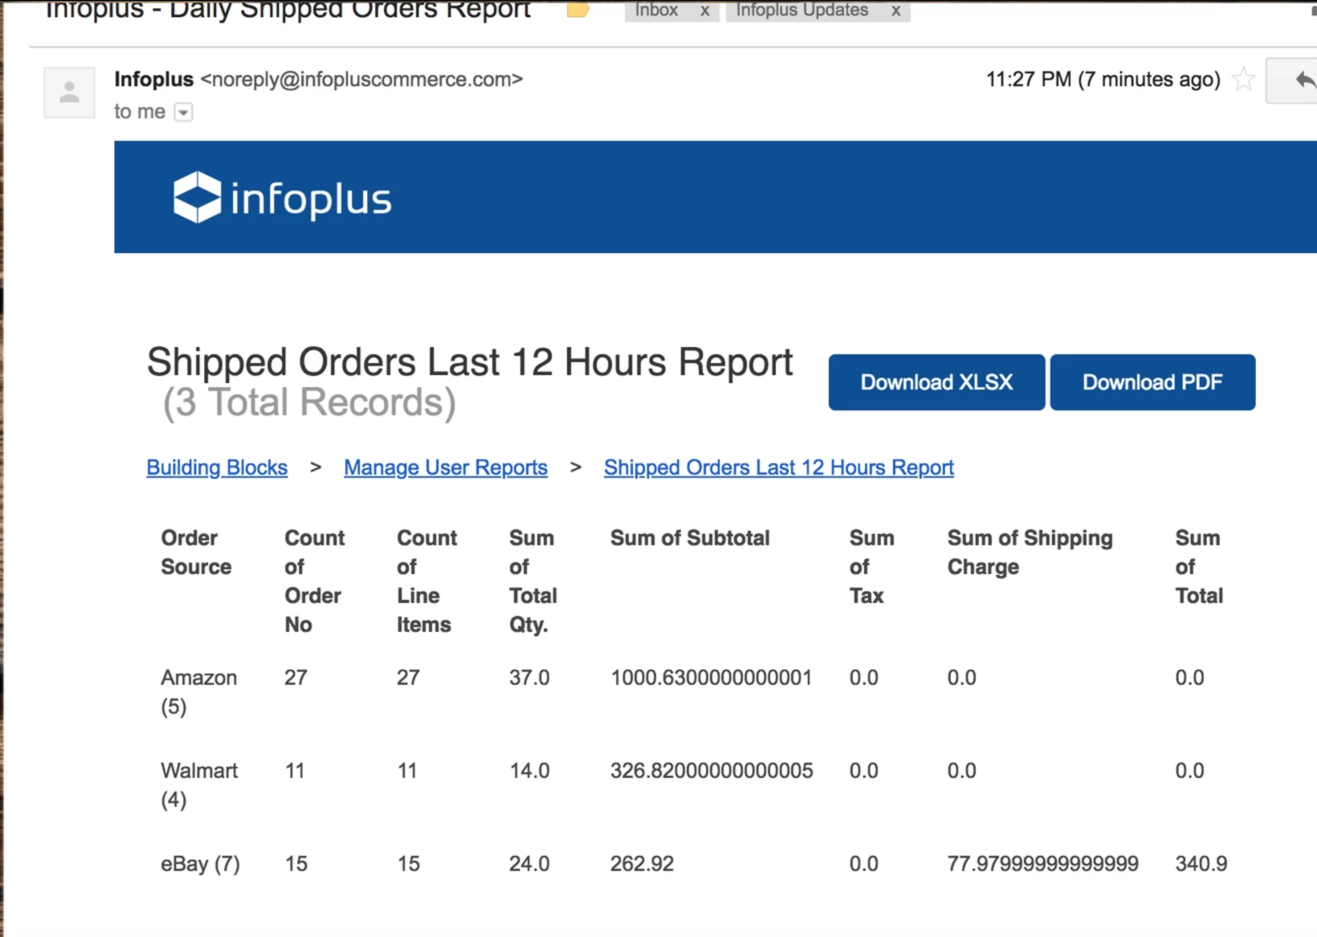
This is an example of how to create and set up User Pivot Reports on a subscription basis. The scenario at hand shows how users can set up a report that details shipped order totals by order source on a daily basis (Eg: the user wants to see total orders by shopping cart). The goal is to have an email sent out every evening with the current days' statistics.
We can assume the operation runs from 9-5 pm. Note that we set our smart filter to look at all shipped orders within the last 12 hours with the intent of setting up a subscription to run every day at 7 pm. We configured the smart filter to only look at orders that were shipped within the last 12 hours and to send the email at 7 pm so that a timeframe of 7 AM-7 PM is covered. This will account for occurrences where operations come in early or stay late, of course, subscriptions can always be adjusted as needed.
Step 1 - Smart Filter
Just like a normal data user report, you will need to have a smart filter created that you want to query the report from. In our example, I have created a Smart Filter on the Order Line table called "Shipped Orders in Last 24hrs". Note that I used the Order Line table so I could have better SKU data. I could have also used the Order table. Here are the filter details:

Step 2 - Creating the User Report
Navigate to the Manage User Report table and opt to create a new report. When prompted, select Pivot report.

Step 3 - Setting Up the Report
Configure the Report to Your Specifications
- Choose the desired Smart Filter and give the report an appropriate name.
- Specify whether you want header and footer rows. Include footer rows if you would like to see the sum, count, average, min, or max for any columns. It is always recommended to have a header row (shows column headers).
- Important Note: PivotTable footers will only show in Excel documents at this time. If you need table summaries, please consider this caveat.
- Next, you will want to specify your Pivot Rows. Since we only want to see order totals by Order Source in this example, I am going to choose Order Source as my only pivot row. Note that you can include more than one pivot row, ie you might show a SKU and its description.
- Finally, select your Pivot Values. Again, you can choose to display the sum, count, average, min, or max.
Example Pivot Settings:
- Footer Values: Subtotal - sum, Total - sum, Shipping Charge - sum, Tax - sum
- Pivot Tables Rows: Order Source
- Pivot Table Values: Order No - Count, Line Item (SKU) - Count, Total Quantity - Sum, Subtotal - sum, Shipping Charge - sum, Tax - sum, Total - sum
Advanced Drop Down
You customize reports via scripts that can be added via the advanced drop-down.


Step 4 - Creating Subscriptions
Once you have created and saved the report, it will show up at the bottom of the list in the Manage User Reports table.
You can add a subscription by clicking on the bubble icon and selecting create new. You can also click on current subscriptions to edit them or delete them. Users can create as many subscriptions as they need. For example, the day shift manager might want to receive this report at a different time than the night shift manager, or a warehouse manager might want it on a daily basis whereas the CEO want's it monthly.

Step 5 - Setting up the Subscription
Tell Infoplus when and where to send out the report.
- Enter all recipients separated by commas.
- Enter an appropriate subject line
- Select whether you want the report to send out if there are no results
- Select the frequency in which the report is sent out
- Week Days: Sun-Fri
- Certain Days of the Month: 1st, Last, 15th, etc.
- Certain Weekdays of the Month: Second Tuesday of Every Month
- Cron Schedule: Every 4 Hours, Every Other Day, Every 5 minutes on Tuesdays between 8 and 5, etc.

You can send out test emails before saving the subscription. Once the email is sent out users will be able to directly download the report to excel or PDF.
Step 5 - Sharing the Report
Click into the sharing bubble icon to share the report with other users. Currently, you can only share with users one at a time.

Step 6 - Adding the Report to Your Dashboard (Favoriting)
To add the report to your dashboard, favorite the report by clicking on the star in front of it.

